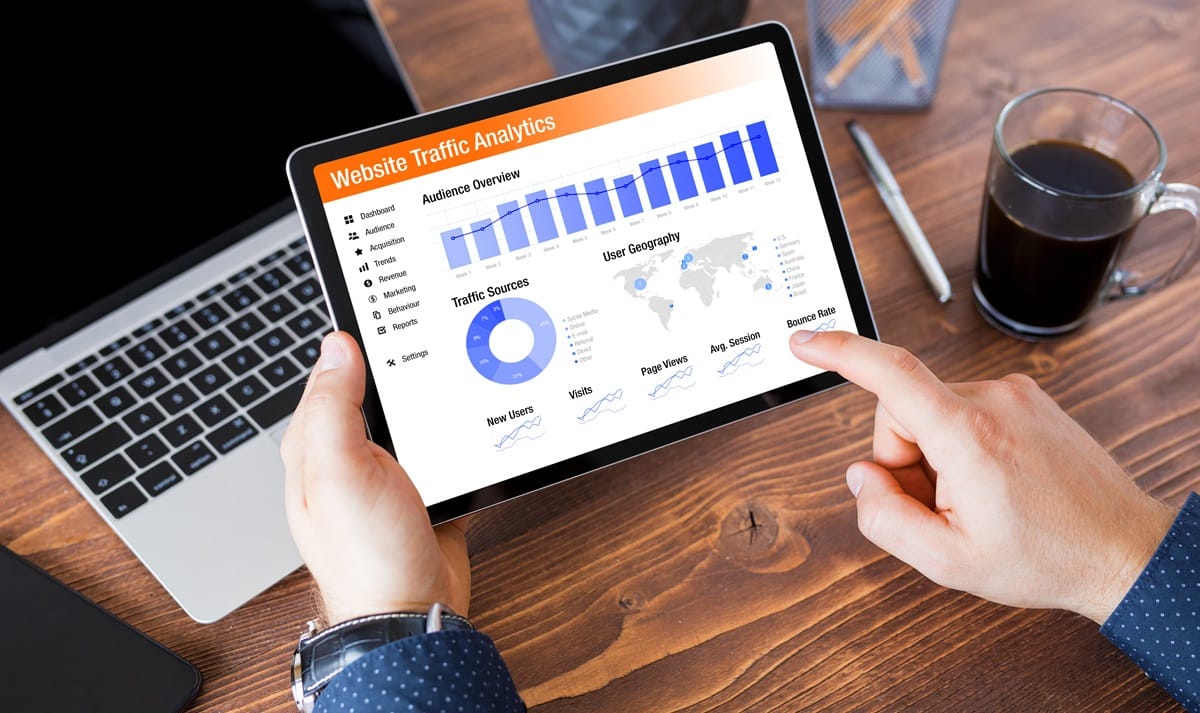
In today’s world a business’s success relies on its online presence. Having a website is key for any business to grow. But it’s just as important to monitor its performance to make sure it’s hitting its mark and understanding how visitors interact with your website gives you the insights to drive growth and improvement.
According to HubSpot businesses that use business analytics are 3.5 times more likely to see big improvements in their marketing.
In this blog we’ll dive into what web analytics is and how can businesses benefit from using analytics on their website.
What is Website Analytics?
Web analytics is the process of measuring, collecting, reporting and analyzing data from a website to understand and optimize how it’s used. What is business analytics? It’s a vital process to understand and improve a website’s digital footprint by analyzing visitor behavior, marketing efforts and decision making through data aggregation and insights.
It’s more than just tracking website traffic; it’s a business analytics and market research tool. Web analytics helps you measure and improve your website by giving you insights into how users are using your site.
By using analytics on your website you can answer questions like:
- How many people visit your site?
- Where do they come from?
- Which pages do they visit?
- How long do visitors spend on your most important pages?
- How many bounce after visiting a single page?
These insights are key to making sure your site is user friendly and resonates with your audience. By understanding the data you can optimize your website, improve user experience and achieve your business goals whether that’s more traffic, more conversions or more sales.
Analytics tools talk to web browsers to track and analyze online behavior. The results are then presented in easy to understand formats like tables, charts or graphs. This allows businesses to make decisions based on real time data and actionable insights.
What are the Types of Web Analytics?
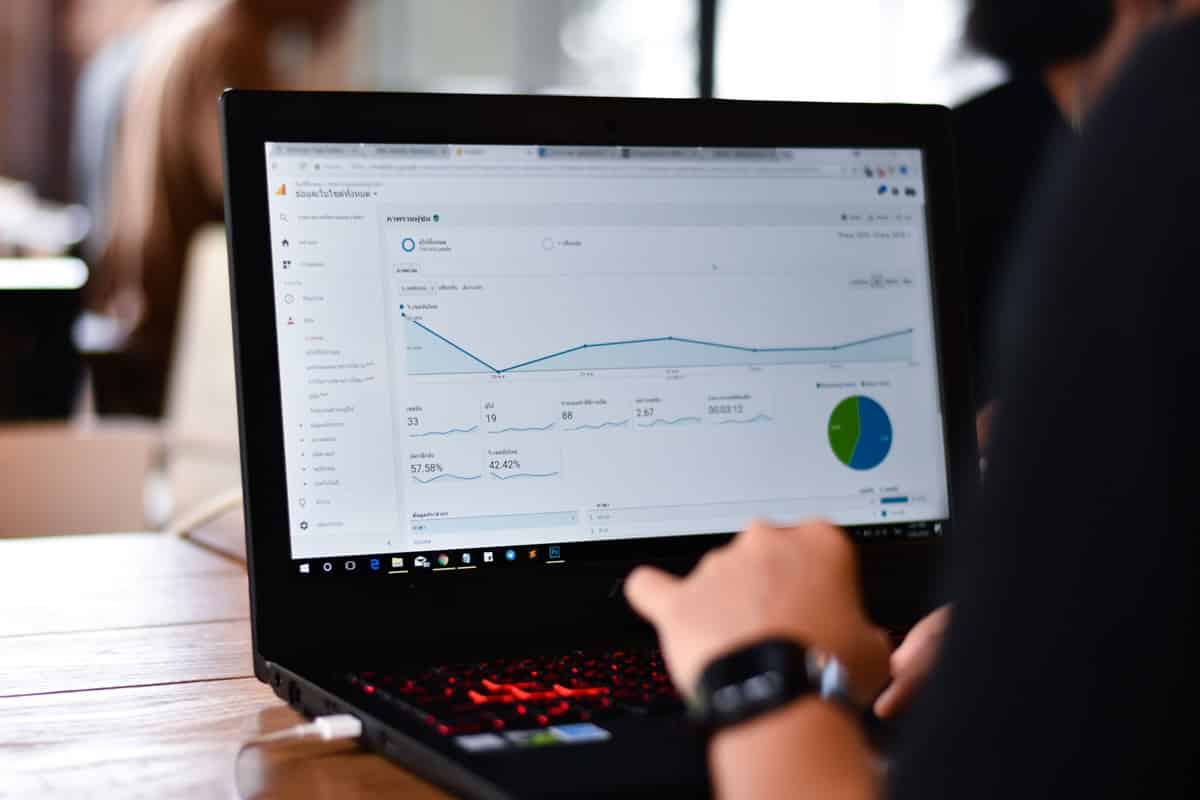
Web analytics isn’t just about numbers. It’s about different types of analysis each serving a purpose. Understanding these types helps businesses get the most out of their web analytics. Here are some common types of web analytics:
Descriptive Analytics: This type of analytics looks at what has happened on your website. It summarizes past data to help you understand user behavior and website performance. For example it can tell you how many visitors you had last month and which pages they visited.
Diagnostic Analytics: Diagnostic analytics goes deeper into the data to explain why something happened. If there was a sudden drop in traffic this analysis will help you identify the reasons, technical issues or changes in search engine algorithms.
Predictive Analytics: This type of analysis uses data to predict future trends and behavior. By analyzing patterns predictive analytics helps you anticipate what will happen next, like forecasting traffic during sales events.
Prescriptive Analytics: Prescriptive analytics goes one step further by telling you what to do based on the data. It recommends the best course of action to improve your website, like optimizing content or redesigning pages to increase conversions.
Each type of web analytics is vital to understanding and optimizing your website. By combining them all you can make decisions that drive growth and improve user experience.
Web analytics tools do all this. Tools like Google Analytics and Adobe Analytics give you insights across all four types.
Why is Website Analytics Important for Business?
Website analytics is for businesses of all sizes. It gives you insights that drive growth, improve performance and improve user experience. Let’s see why website analytics is important for business websites.
Website Performance
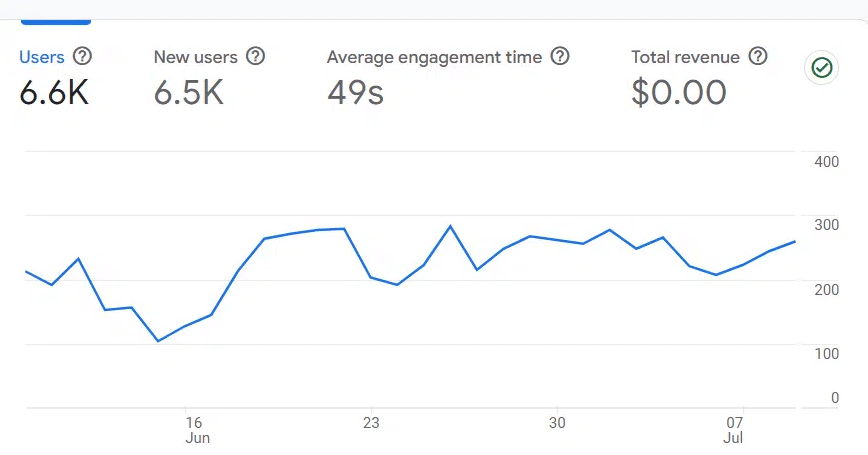
Analytics will identify issues that are hurting your website. It will highlight slow loading pages, high bounce rates or broken links.
By fixing these issues you can improve user experience and keep visitors engaged.
For example if you see a page with a high bounce rate it might mean the content isn’t resonating with visitors. Using analytics you can identify these weak spots and make the necessary changes to keep visitors on your site longer.
Tracking Campaigns
Web analytics allows you to track your marketing campaigns. You can see which channels are driving traffic, generating leads and resulting in sales.
This is key to making data driven decisions and ensuring your marketing budget is being spent wisely.
For example if an email campaign is driving more traffic than a social media campaign you can allocate more resources to email marketing. This targeted approach will maximize the ROI from your marketing.
SEO Strategies
Web analytics will show you which keywords and search terms are bringing visitors to your site. By knowing what drives traffic you can refine your SEO.
This means optimizing content and meta descriptions to match what your potential customers are searching for online.
For example if you see a particular keyword is driving a lot of traffic you can create more content around that keyword. This will improve your search engine rankings and increase organic traffic.
Measure ROI and Growth
Measuring ROI and linking to growth is key. Website analytics measures the return on investment (ROI) from digital marketing so every dollar spent is justified. By looking at performance trends you can see where you’re doing well or where you need to improve. This data driven approach allows you to forecast future revenue and make decisions that drive growth.
For example if analytics show a particular campaign is high ROI you can allocate more resource to that strategy. If a campaign is under performing you can adjust to make it better so every effort is contributing to overall business growth.
What are the benefits of Website Analytics?
Using analytics on your website gives you the insights to improve, enhance user experience, grow and more. Let’s see how businesses benefit from website analytics.
1. See How Customers Behave
Seeing how customers behave on your website is key to understanding how they interact with your content. Web analytics tools like Google Analytics will give you the reports to see how they interact and where to improve.
Behavior Reports: Show user actions on your site, page views, load times and navigation paths. This will help you see where users drop off or stay engaged.
Behavior Flow: Visualizes the path users take through your site. This will help you see how they move from one page to another and where they might be getting stuck.
Site Content: Shows if users are on mobile, if they buy, and how they found your content. This will help you see which content is performing and why.
Site Speed: Tracks how fast your pages load and highlights performance issues like slower load times for mobile users. Faster load times will improve user experience and reduce bounce rates.
Site Search: Shows how visitors use the search function on your site. This will show you popular search terms and content gaps so you can optimize your site.
2. Acquisition
Acquisition data is key to understanding how visitors found your website and what they do once they get there. This is important for optimizing your marketing and making sure your audience is engaged.
All Traffic: This report will show you which channels drive the most traffic to your website, organic search, social media or referrals.
It breaks down data by Channels and Source/Medium so you can see which sources are working for your site and where to improve.
Google Ads: Connecting Google Ads with Google Analytics will give you in depth insights into how your campaigns are performing on the website.
You can track metrics like campaign success, keyword performance and which hours of the day are best. This will help businesses benefit from using analytics on their website to get more from their ad spend.
Search Console: By connecting Google Search Console with Google Analytics you’ll get data on how your site performs in organic search. This includes landing pages, countries, devices and search queries.
With this you can optimize content that ranks well but has a low click through rate so your website gets more relevant traffic.
Social: The Social tab shows you how your content is performing across various social media platforms. You can see which networks drive the most traffic, which landing pages are popular and how social media affects overall site behavior.
This is key to using analytics for your social media.
Campaigns: The Campaigns report will show you how your paid marketing campaigns are performing, including those outside of Google if you upload the cost data.
This will help you compare different marketing initiatives so you can allocate resources more effectively and see how businesses benefit from using analytics to win.
3. Conversion Rate Optimization (CRO)
Conversion Rate Optimization (CRO) is about improving the percentage of visitors who complete a desired action on your website. Whether it’s signing up for a newsletter or buying something, using analytics on your website will help businesses fine tune their strategy and increase conversions.
Goals: In Google Analytics you can set up specific goals like making a purchase or signing up for an email list. Tracking these goals will show you which actions are driving conversions and how users are navigating your site to get to those outcomes.
eCommerce Performance: For eCommerce sites, tracking product sales and transactions is key. By setting up eCommerce tracking you can see which products are performing best, how long customers take to buy and overall sales on your website.
Channel Contributions: Different marketing channels like email, social media and organic search drive conversions in different ways.
By seeing how these channels work together you can optimize your marketing to improve overall conversion rates on your site.
Attribution Models: Attribution models will show you how different marketing touch points contribute to a conversion. For example if a user reads an email, downloads a whitepaper and then makes a purchase the attribution model will determine how much credit is given to each action.
This will show you which channels and actions are working best on your website.

4. Real-Time Reporting
Real-Time Reporting in Google Analytics gives you instant insights into what’s happening on your website right now. This will allow you to see what’s happening as it happens and make quick decisions and changes.
Monitoring Current User Activity: With real-time data you can see who’s on your site and what they’re doing. This is especially useful after publishing new content like a blog post or video to see how users are interacting with it straight away.
User Locations: The Locations report will show you where your users are coming from, including time zones and languages. Knowing where your audience is will help you tailor your content and marketing to them.
Traffic Sources: This report will show you where users are coming from in real-time. Whether they clicked a link from social media or typed in your URL directly you can see which channels are driving the most traffic.
User Engagement: The Content report will show you which pages users are landing on and how long they’re staying. This will help you see which content is working in real-time.
Event Tracking: Real-time events track specific actions on your site like ad clicks, downloads or video views. This will show you how users are interacting with different parts of your website as it happens.
Monitoring Conversions: Real-Time Reporting will also track conversions, showing how many users are completing desired actions on your site in real-time. This is key to understanding the immediate impact of your marketing.
5. Know Your Audience
Knowing your audience is key to tailoring your website and marketing to them. Google Analytics has audience reports that will help you segment and analyze your users, give you insights into their behavior, interests and demographics. Here’s how:
Active Users: See users who have visited your site in specific time frames like last 1, 5, 10 or 20 days. This will help you measure audience interest and engagement over time and adjust your strategies accordingly.
Lifetime Value: Measure the long-term value of users acquired through different channels like social media, organic search or referrals. This report will show you which acquisition methods are giving you the best return and where to allocate your resources.
Cohort Analysis: Analyze groups of users who have a common trait, like visiting your website on the same day. This will show you how these groups behave over time and how specific events or campaigns impact user behavior.
Demographics and Interests: Get detailed information about your users’ age, gender and interests. This will allow you to tailor your content, ads and marketing to their preferences and get higher engagement and conversion rates.
Behavior and Technology: See how users interact with your site, whether they’re new or returning visitors, how often they visit and what devices they use. This will help you optimize your site for better performance across different platforms and devices.
Users Flow: See the paths users take through your website. This report will show you where users start, where they go next and where they drop off and help you identify and fix issues in the user journey.
6. Improving User Experience (UX)
User Experience (UX) is about making your website easy and enjoyable to use. A good UX keeps users engaged, reduces bounce rates and increases conversions. Here’s how website analytics can help:
Identify Pain Points: Analytics on your website will show you where users are struggling, like slow loading pages or confusing navigation. By identifying these pain points you can make changes to make it smoother.
Monitor User Behavior: Tools like heatmaps and session recordings will show you visually how users are interacting with your site. This will help you see where users are clicking, how far they’re scrolling and what they find engaging or frustrating.
Optimize for Mobile: Web analytics will show you how mobile visitors are interacting with your website. If your site isn’t mobile optimized users will leave quickly. By analyzing this data you can make changes to improve the mobile experience.
Test and Improve: Use A/B testing to try different designs, layouts and content. Web analytics will track which versions perform better and you can continually refine your website to meet user needs.
Enhance Page Speed: Slow loading pages will frustrate users and increase bounce rates. Analytics tools will help you monitor page load times and identify performance issues so you can optimize and keep users engaged.
7. Data-Driven Decision Making
Data-driven decision making is using website analytics to inform business strategy. This means making decisions based on facts not intuition or guesswork. Here’s how data-driven decision making benefits your business:
Objective Insights: Analytics on your website will give you factual data about user behavior, traffic sources and conversion rates. This will allow you to base your decisions on clear objective insights.
Optimize Marketing Strategies: By analyzing data from your website you can see which marketing channels are working. This will help you allocate resources more efficiently and focus on the strategies that deliver the best results.
Product Development: Analytics will help you understand customer preferences and pain points. This will guide product development so new products are in line with what customers want and need.
Customer Experience: Web analytics data can be used to refine your website and customer service strategies. You can see trends and patterns that will show you what customers are looking for and tailor their experience better.
Forecasting and Planning: Analytics will help you predict future trends based on historical data. You can use this to plan long term and anticipate market shifts and stay one step ahead of the competition.
Data-driven decision making ensures that every choice your business makes is supported by reliable data, leading to better outcomes and a more strategic approach to growth.
How Does Website Analytics Work?

Website analytics tracks and analyzes data from people who visit your website. This is key to understanding user behavior and making informed decisions to improve your site. Here’s how website analytics works:
- Data Collection: When someone visits a website, analytics tools (like Google Analytics) collect data through tracking codes or cookies in the website’s code. These tools grab info like page views, time on site, user location, device type and more.
- Data Processing: The raw data is processed and organized into meaningful metrics and dimensions. This involves filtering out spam, bot traffic and other irrelevant data to get accuracy.
- Data Analysis: The processed data is analyzed to find patterns, trends and insights. This can include understanding user behavior, traffic sources, conversion rates and other key performance indicators (KPIs).
- Reporting: Analytics platforms provide reports and dashboards to visualize the data so businesses can interpret and understand the insights. These reports can be customized to focus on specific metrics or time periods.
- Actionable Insights: Based on the analysis businesses can derive actionable insights to improve website performance, user experience and business goals. This might mean optimizing content, improving site navigation or targeting specific audience segments.
How Do Companies Set Up Web Analytics on Their Websites?
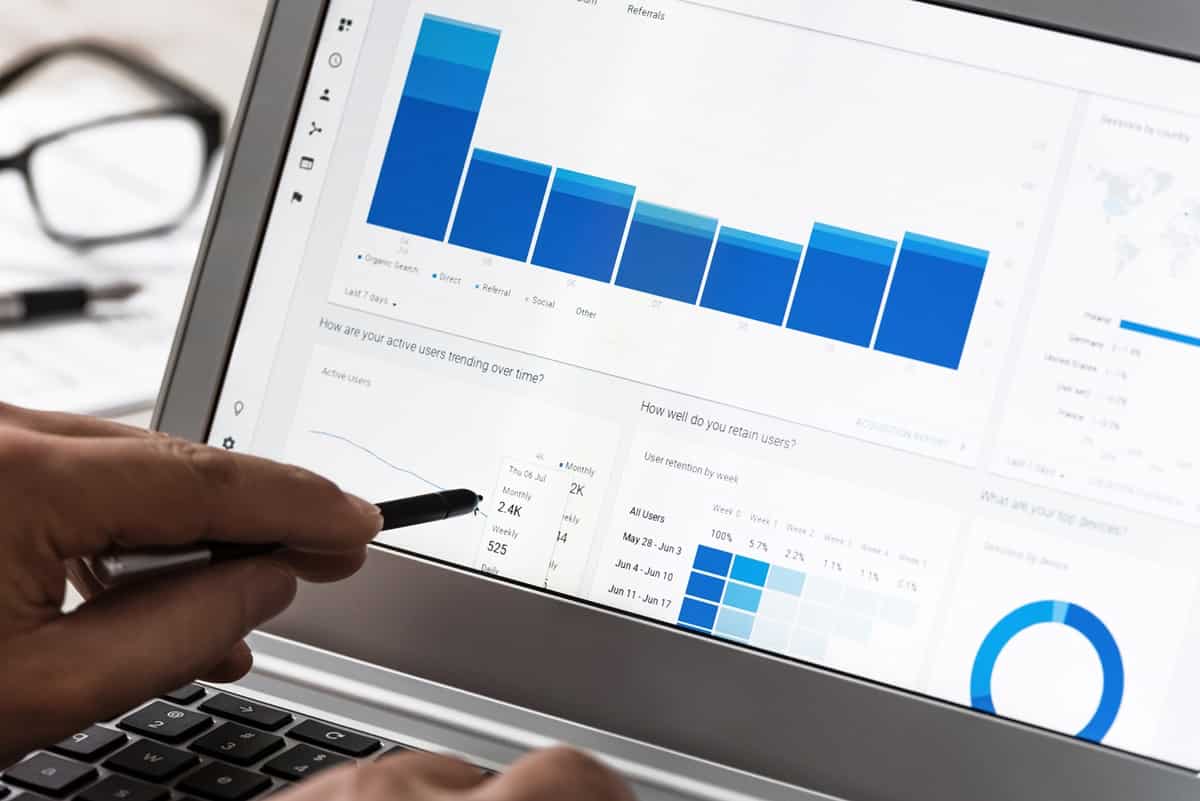
Setting up website analytics right is key to getting accurate data and valuable insights into your website’s performance. Follow these step-by-step instructions to make sure your website analytics is set up correctly.
Step 1: Choose the Right Tool
Pick the Analytics Platform: First step is to choose the analytics tool that suits your business. Popular options are Google Analytics, Adobe Analytics and others depending on your needs.
Sign Up and Create an Account: Once you’ve chosen a tool, sign up and create an account. Google Analytics is free and most popular so it’s a good starting point for most businesses.
Step 2: Set Up Tracking Codes
Get the Tracking Code: After setting up your account the analytics tool will generate a unique tracking code (JavaScript snippet).
Add the Tracking Code to Your Website: Put this tracking code in the header section of every page on your website. This will collect data from all pages.
Check Tracking Code: Use the analytics tool’s interface to check if the tracking code is installed correctly and collecting data.
Step 3: Basic Setup
Set Up Goals: Define what actions on your website you want to track as goals. This could be form submissions, product purchases or newsletter signups.
Link Other Accounts: Link other tools like Google Search Console or Google Ads to Google Analytics to get more insights into traffic sources and campaign performance.
Exclude Internal Traffic: To get accurate data set up filters to exclude traffic from your own company’s IP addresses.
Step 4: Create Custom Dashboards and Reports
Custom Dashboards: Set up dashboards to monitor the metrics that matter to your business. This could be conversion rates, bounce rates, traffic sources.
Schedule Reports: Set up reports to be sent to you automatically at regular intervals. So you don’t have to log in every now and then.
Step 5: Set Up Event Tracking and E-commerce Tracking
Event Tracking: Set up event tracking for specific interactions like video plays, downloads or clicks on specific buttons.
E-commerce Tracking: If you have an online store enable e-commerce tracking to monitor product sales, revenue and other related metrics. This requires additional code snippets on your website.
Step 6: Monitor and Optimize
Review Data: Regularly check the analytics dashboard to monitor key metrics. Look for trends, anomalies and opportunities to improve.
Make Data-Driven Decisions: Use the insights to make informed decisions about your website, marketing and business goals.
FAQ’s
How Website Analytics Impacts User Experience (UX)?
Website analytics helps identify where users struggle, like slow load times or confusing navigation. Fixing these issues makes the experience smoother.
How Analytics Helps Identify and Predict Trends?
Analytics identifies and predicts trends by analyzing historical data so businesses can adjust strategy based on customer behavior and market changes.
What are the Common Issues with Website Analytics?
Issues are data accuracy, interpreting complex data and integrating analytics with other tools to get a complete view of website performance.
What are the Privacy Issues with Website Analytics?
Privacy issues are about user data. Compliance with GDPR and using anonymized data will help protect user privacy.
What can you get from website analytics?
Analytics tools give you insights into user behavior, traffic sources, page performance and conversion rates to optimize website.
What’s the most important type of business analytics?
Predictive analytics is key as it forecasts future trends so businesses can make informed decisions and plan for growth.


